Introduction
Excel is a spreadsheet program that is part of the Microsoft Office suite of tools. It is widely used for data analysis, financial modeling, and a variety of other tasks that require working with large amounts of data. Whether you are just starting out or are looking to improve your skills, this guide will provide a comprehensive introduction to Microsoft Excel.
Understanding the Excel Interface
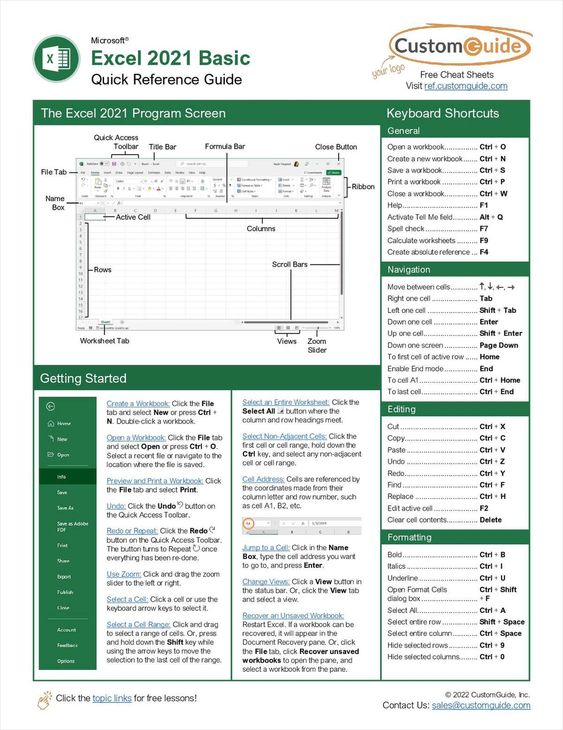
The Excel interface is composed of several key elements, including the ribbon, cells, and worksheet tabs. The ribbon contains the commands and functions you need to work with your data. Cells are the individual boxes that make up your worksheet, and worksheet tabs allow you to switch between different worksheets within a single workbook. It is important to familiarize yourself with the Excel interface so that you can work effectively and efficiently.
Entering and Editing Data
Once you have a basic understanding of the Excel interface, it is time to start entering data into your worksheet. To enter data into a cell, simply click on the cell and start typing. You can also use the mouse or the arrow keys to navigate between cells. To edit data, simply click on the cell and make your changes. Excel provides several tools to help you format your data, such as changing font size and color, aligning text, and adding borders.
Basic Formulas and Functions
Excel provides a wide range of formulas and functions that you can use to perform calculations on your data. Some of the most common formulas include SUM, AVERAGE, and COUNT. Functions are similar to formulas, but they provide more advanced calculations, such as financial and statistical functions. To use a formula or function, simply type the appropriate syntax into a cell and press Enter.
Formatting and Customizing Worksheets
Excel provides a number of tools to help you format and customize your worksheets. This includes tools to change the font, add borders and shading, and adjust the column width and row height. You can also use conditional formatting to highlight cells that meet specific criteria, such as cells that contain values above or below a certain threshold. Customizing your worksheets can help you better understand and analyze your data.
Charts and Graphs
Excel provides a variety of tools to help you visualize your data, including charts and graphs. Charts and graphs can help you quickly see patterns and relationships in your data that might be difficult to see in a table. To create a chart or graph, simply select the data you want to include and then click the appropriate button on the ribbon. You can customize the look of your chart or graph by changing the colors, labels, and other elements.
Pivot Tables
Pivot tables are a powerful tool in Excel that allow you to summarize and analyze large amounts of data. A pivot table allows you to group data by one or more categories, such as date, product, or region. This can help you quickly see trends and patterns in your data. To create a pivot table, simply select the data you want to include and then click the appropriate button on the ribbon. From there, you can customize the pivot table to meet your needs.
You might find these FREE courses useful
Conclusion
Excel is a powerful tool that can help you analyze and understand large amounts of data. Whether you are just starting out or are looking to improve your skills, this guide provides a comprehensive introduction to Microsoft Excel. With a basic understanding of the Excel interface, entering and editing data, formulas and functions, formatting and customizing worksheets, charts and graphs, and pivot tables, you will be well on your way to mastering this powerful program.


