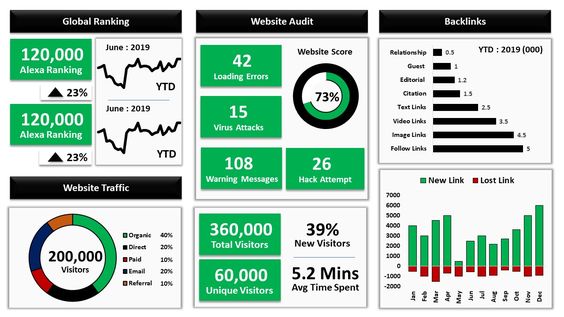
Excel is a powerful tool for data analysis. It is a versatile program that can be used to manipulate, analyze, and visualize data in a variety of ways. This guide will provide an overview of the essential features of Excel data analysis, including data cleaning, organizing, and visualization.
Importing Data
Excel can import data from a variety of sources, including databases, web pages, and text files. When importing data, it is important to choose the appropriate file type and correctly format the data. Excel provides several tools for importing data, including the Data Import Wizard and the Get Data feature.
Cleaning Data
Before analyzing data, it is essential to ensure that it is clean and organized. This involves identifying and correcting errors and inconsistencies in the data, such as missing values, duplicated entries, and formatting issues. Excel provides several tools for cleaning data, including the Find and Replace feature and the Remove Duplicates tool.
Organizing Data
Excel allows you to organize data in a variety of ways, including tables, charts, and pivot tables. Tables are useful for sorting and filtering data, while charts can be used to visualize trends and patterns in the data. Pivot tables provide a powerful way to summarize and analyze large datasets.
Data Analysis Tools
Excel provides several built-in tools for data analysis, including regression analysis, descriptive statistics, and hypothesis testing. These tools can be used to identify relationships between variables, calculate summary statistics, and test hypotheses about the data.
Conditional Formatting
Conditional formatting is a powerful feature in Excel that allows you to highlight specific data points based on certain criteria. This can be useful for identifying outliers, trends, and other patterns in the data. Excel provides several options for conditional formatting, including color scales, data bars, and icon sets.
What-If Analysis
Excel also allows you to perform what-if analysis, which involves changing input values and observing the resulting changes in the output. This can be useful for predicting future outcomes and testing different scenarios. Excel provides several tools for what-if analysis, including Goal Seek and Solver.
Macros and VBA
Excel provides the ability to automate tasks and customize functionality using macros and Visual Basic for Applications (VBA). Macros allow you to record and play back repetitive tasks, while VBA provides a more powerful scripting language for customizing Excel functionality.
Collaboration and Sharing
Excel provides several options for collaboration and sharing, including shared workbooks, co-authoring, and cloud storage. These features allow multiple users to work on the same file simultaneously and can be useful for distributed teams and remote work.
- Excel Basics for Data Analysis
- Work Smarter with Microsoft Excel
- Excel Fundamentals for Data Analysis
- Excel Modeling for Professionals: Best Practices
Conclusion
Excel is a versatile and powerful tool for data analysis, providing a wide range of features for importing, cleaning, organizing, visualizing, and analyzing data. By mastering these features, users can gain valuable insights from their data and make informed decisions based on their findings. Whether you’re a business analyst, data scientist, or student, Excel can be an invaluable tool for your data analysis needs.


