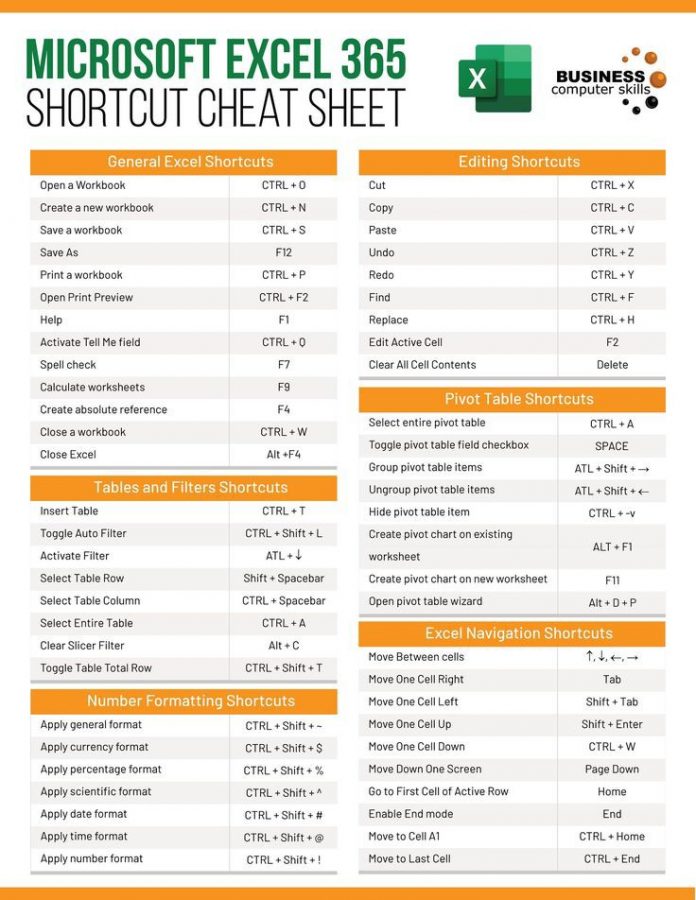
Microsoft Excel is a powerful tool that can help you organize and analyze data, create charts and graphs, and perform various calculations. Whether you’re a student, a professional, or just someone who wants to learn a new skill, this Excel guide for beginners will help you get started with using this software to its full potential.
Introduction
Excel is a spreadsheet program that’s part of the Microsoft Office suite of applications. It’s used by businesses, schools, and individuals to store, organize, and analyze data. With Excel, you can create spreadsheets that allow you to input, manipulate, and visualize data. In this guide, we’ll take you through the basics of using Excel and help you get started on your journey to becoming an Excel pro.
Getting Started with Excel
Before we dive into the specifics of using Excel, let’s take a moment to look at the basics. When you first open Excel, you’ll see a blank workbook with one worksheet. A workbook is the Excel file that you’ll use to store all of your data, and a worksheet is a single sheet within the workbook. Each worksheet is divided into columns and rows, and you can enter data into the cells where the columns and rows meet.
Entering and Formatting Data
Once you’ve got a feel for the basic structure of an Excel worksheet, you can start entering data into your spreadsheet. To do this, simply click on a cell and start typing. You can enter numbers, text, or dates into a cell. Once you’ve entered your data, you can format it to make it look the way you want. For example, you can change the font, the font size, and the font color. You can also align the text within the cell, and you can apply a border or fill color to the cell.
Performing Calculations
One of the key benefits of using Excel is the ability to perform calculations on your data. You can use basic mathematical operators like addition, subtraction, multiplication, and division, and you can also use more advanced functions like SUM, AVERAGE, and COUNT. To perform a calculation, simply enter a formula into a cell. For example, if you want to add up the values in cells A1 through A5, you would enter the formula “=SUM(A1:A5)” into a cell.
Visualizing Data
Once you’ve entered and formatted your data, you can use Excel’s built-in charting tools to visualize your data. You can create bar charts, line charts, pie charts, and more. To create a chart, first select the data that you want to use. Then, go to the Insert tab, click on the type of chart you want to create, and follow the steps to customize your chart. You can format the chart to make it look the way you want, and you can even add labels, legends, and titles.
You might find these FREE courses Useful:
- Everyday Excel, Part 3 (Projects)
- Excel for Beginners: Sorting, Filtering, Data-Validation
- Create a Mortgage Calculator in Excel
Conclusion
Excel is a powerful tool that can help you organize, analyze, and visualize data. Whether you’re a student, a professional, or just someone who wants to learn a new skill, this Excel guide for beginners will help you get started on your journey to becoming an Excel pro. With a little practice and some time, you’ll be able to use Excel to its full potential and unlock its many benefits.


