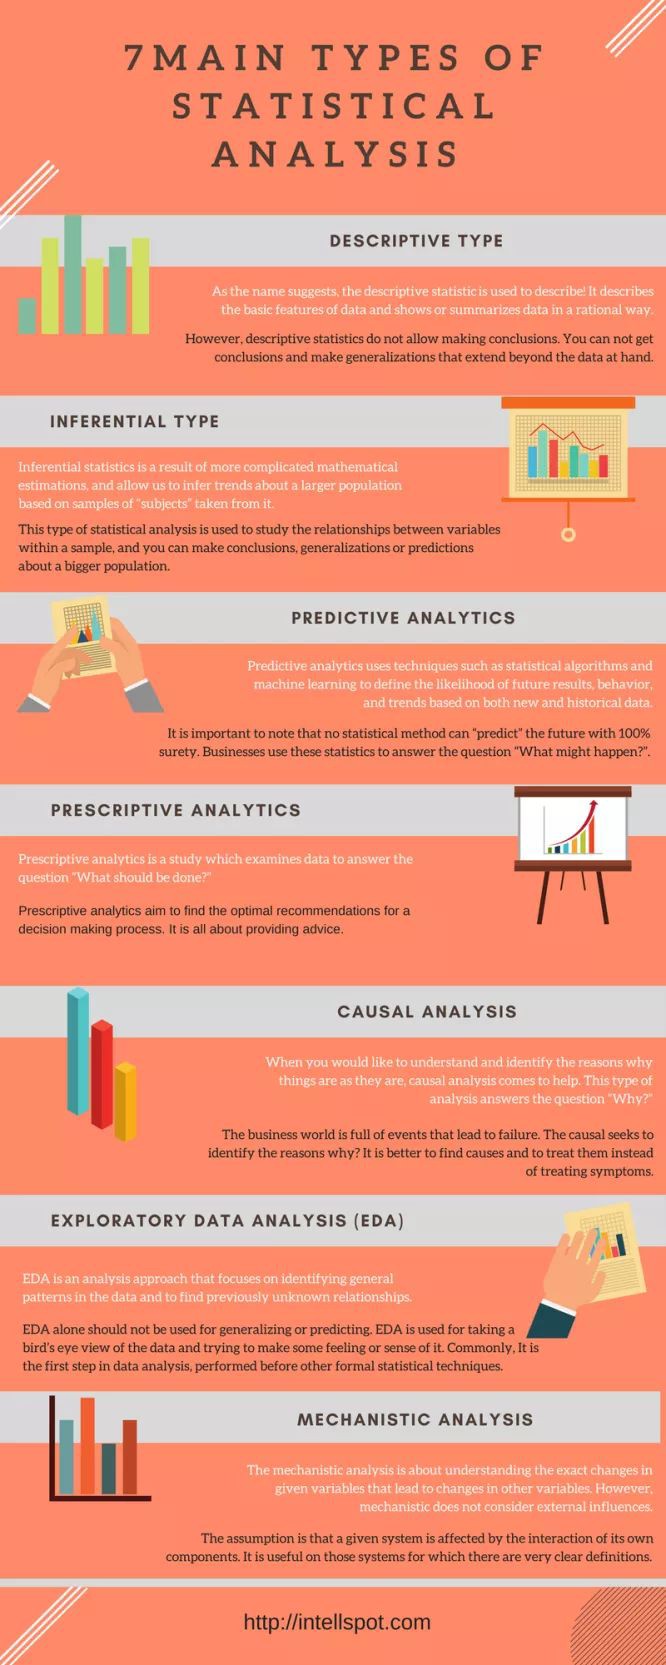
Data analysis is a crucial tool for gaining insights, making informed decisions, and driving business success. However, the process can seem daunting for those who are new to it. This guide will provide a step-by-step overview of how to analyze data effectively and make the most of the insights you uncover.
Define the problem and set goals
The first step in any data analysis is to clearly define the problem you are trying to solve and set specific goals for what you want to achieve. This will help you focus your efforts and ensure that you are using the right data and methods to get the answers you need.
Gather and clean the data
Once you have defined the problem and set your goals, the next step is to gather and clean the data you need to analyze. This may involve collecting data from various sources, such as databases, spreadsheets, or APIs. Cleaning the data involves removing any irrelevant or incorrect information and ensuring that it is organized and formatted in a way that makes it ready for analysis.
Explore the data
Before diving into more advanced analysis methods, it is important to get a preliminary understanding of the data you are working with. This includes creating visualizations such as histograms and scatter plots to understand the distribution and relationships between variables. You may also want to calculate summary statistics such as mean, median, and standard deviation.
Choose the appropriate method
There are many different methods and techniques that can be used to analyze data, depending on the specific problem you are trying to solve and the type of data you are working with. Common methods include regression analysis, clustering, and decision trees. Choose the method that best fits your problem and data, and be sure to have a solid understanding of the assumptions and limitations of the method you choose.
Conduct the analysis
Once you have chosen the appropriate method, it’s time to actually conduct the analysis. This may involve using software such as R or Python, or using built-in tools in programs such as Excel or Google Sheets. The goal of this step is to use the method you have chosen to extract insights from the data and answer the questions you set out to address.
Visualize and interpret the results
Visualizing the results of your analysis is a crucial step in understanding and communicating the insights you have uncovered. Choose appropriate visualizations that clearly and effectively communicate your results, and use them to interpret what the data is telling you.
Validate the results
It is important to validate the results of your analysis to ensure that they are accurate and reliable. This may involve using multiple methods and comparing the results, or using a subset of the data to confirm your findings.
Draw conclusions and make decisions
The final step in data analysis is to draw conclusions and make decisions based on the insights you have uncovered. Use the results of your analysis to make informed decisions, such as identifying areas for improvement, exploring new opportunities, or making changes to your business strategy.
You might find these FREE courses useful:
- Data Analysis in Python: Using Pandas DataFrames
- Python for Data Analysis: Pandas & NumPy
- Data Analysis and Representation, Selection
Conclusion
Data analysis is a powerful tool for unlocking insights and driving decisions, but it can seem daunting for those who are new to it. By following these steps, you can effectively analyze data and make the most of the insights you uncover. From defining the problem and gathering data, to choosing the right method and drawing conclusions, data analysis can help you make informed decisions and achieve your goals.


